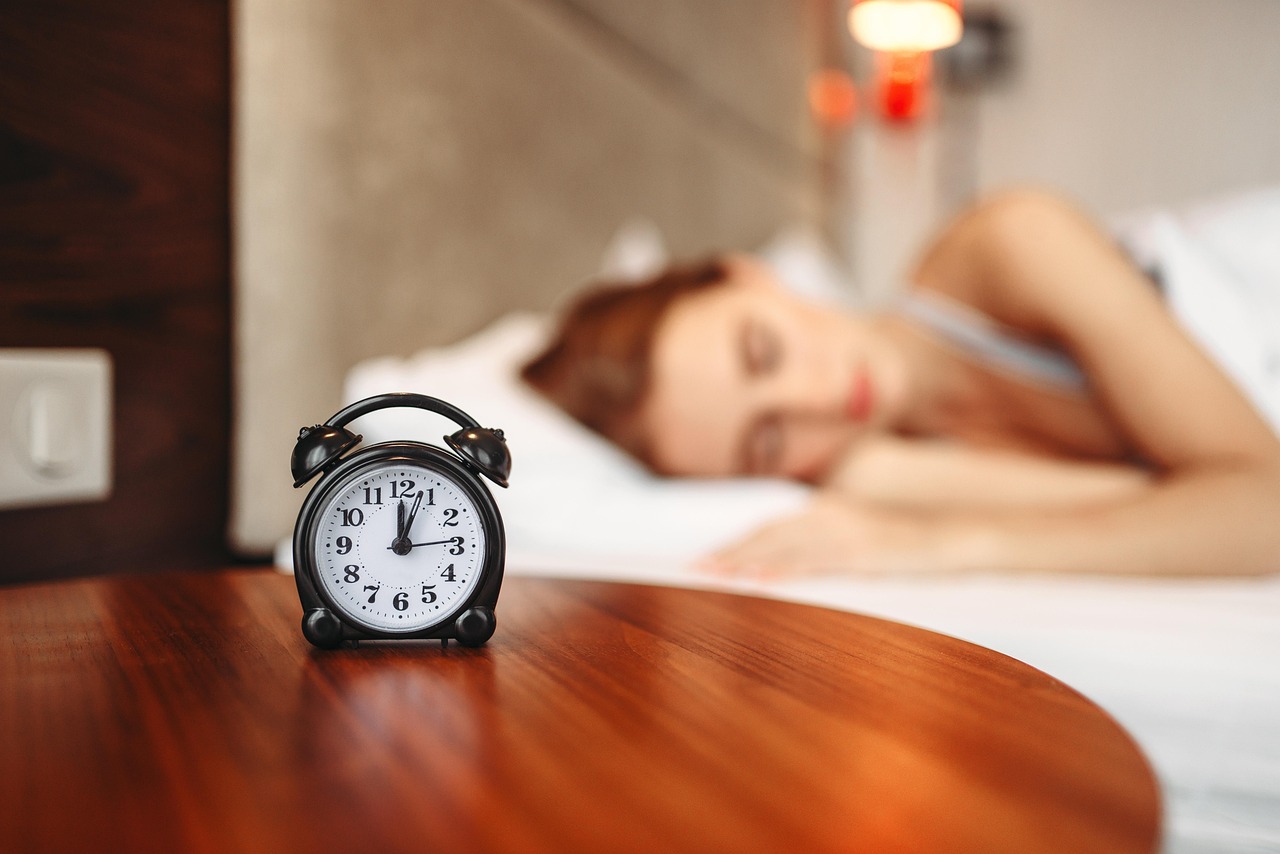
Quality sleep is no longer a mystery reserved for scientists and doctors. With the rise of visual sleep dashboards, anyone can now understand their rest patterns and take meaningful action to improve them. 🌙
Modern sleep tracking technology has transformed how we approach rest, making it accessible and actionable for everyone. Gone are the days of wondering why you wake up tired or struggling to identify what disrupts your sleep. Visual dashboards now provide crystal-clear insights into your sleep architecture, helping you make informed decisions about your bedtime routines and lifestyle choices.
Why Visual Sleep Dashboards Matter More Than Ever
The average person spends approximately one-third of their life sleeping, yet most people know remarkably little about the quality of their rest. Traditional methods of assessing sleep quality relied heavily on subjective feelings and guesswork. Visual sleep dashboards have revolutionized this approach by translating complex sleep data into easy-to-understand graphics, charts, and metrics.
These dashboards compile information from various sources—including movement sensors, heart rate monitors, and environmental factors—to create a comprehensive picture of your nightly rest. The visual nature of these tools makes it simple to spot patterns, identify problems, and track improvements over time without requiring a medical degree to interpret the results.
Understanding the Key Metrics on Your Sleep Dashboard 📊
Most sleep tracking dashboards display several critical metrics that together paint a complete picture of your sleep quality. Understanding what these numbers mean empowers you to make targeted improvements.
Sleep Duration and Sleep Debt
Your dashboard typically shows total sleep time compared against your personal sleep goal, usually between seven to nine hours for adults. Sleep debt accumulates when you consistently sleep less than your body needs, and visual representations help you see this deficit building over days or weeks.
The color-coded systems used in most dashboards make it immediately obvious whether you’re meeting your sleep targets. Red or orange indicators signal insufficient sleep, while green confirms you’re on track. This instant visual feedback creates accountability and motivation to prioritize rest.
Sleep Stages Breakdown
Modern dashboards break down your night into distinct sleep stages: light sleep, deep sleep, and REM (rapid eye movement) sleep. Each stage serves unique restorative functions, and the ideal balance varies slightly between individuals.
Visual representations typically show these stages as stacked bar charts or wave patterns across your sleep period. Deep sleep supports physical recovery and immune function, while REM sleep consolidates memories and processes emotions. Light sleep serves as a transition phase and comprises the largest portion of your night.
Sleep Efficiency Score
Sleep efficiency measures the percentage of time in bed that you actually spend sleeping versus lying awake. A score above 85% is generally considered good, while anything below 80% suggests room for improvement. Dashboard visualizations make this metric instantly graspable through percentage displays and comparative graphs.
How Visual Dashboards Simplify Complex Sleep Science
The human sleep-wake cycle involves intricate biological processes governed by circadian rhythms, homeostatic sleep pressure, and environmental factors. Sleep dashboards distill this complexity into actionable insights without overwhelming users with scientific jargon.
Color psychology plays a significant role in dashboard design. Calming blues and purples often represent sleep periods, while oranges and yellows indicate wakefulness or disruptions. These intuitive color schemes align with natural associations, making data interpretation feel effortless and natural.
Trend lines and historical comparisons allow you to see progress over weeks and months. Instead of focusing solely on single nights—which naturally vary—dashboards highlight patterns that reveal whether your sleep quality is genuinely improving or declining over time.
Tracking Environmental Factors That Impact Your Rest 🌡️
Advanced sleep dashboards incorporate environmental data that influences sleep quality. These factors often go unnoticed but significantly affect how well you rest each night.
Temperature and Humidity Monitoring
Your bedroom’s temperature dramatically impacts sleep quality, with most experts recommending between 60-67°F (15-19°C) for optimal rest. Visual dashboards that track temperature throughout the night can reveal correlations between room conditions and sleep disruptions.
Humidity levels also matter, with extreme dryness or dampness affecting comfort and respiratory ease. Dashboard graphs showing these variables alongside your sleep stages help identify whether environmental adjustments could improve your rest.
Light and Noise Exposure
Light exposure suppresses melatonin production, making it harder to fall asleep and reducing sleep quality. Dashboards that monitor ambient light levels can show you whether streetlights, electronics, or early morning sun are disrupting your rest cycles.
Similarly, noise tracking identifies disturbances you might not consciously remember. Visual representations of noise spikes correlated with movement or awakening periods provide concrete evidence of environmental issues worth addressing.
Connecting Lifestyle Habits to Sleep Quality
The most powerful feature of comprehensive sleep dashboards is their ability to correlate daily activities with nightly rest quality. This connection transforms abstract advice into personalized, evidence-based recommendations.
Exercise Timing and Intensity
Many sleep tracking systems allow you to log workouts, then display how exercise timing relates to your sleep metrics. You might discover that vigorous evening workouts delay your ability to fall asleep, while morning or afternoon exercise promotes deeper rest.
Dashboard visualizations make these connections obvious through side-by-side comparisons or overlay graphs. What works for one person might not work for another, and visual data helps you discover your unique patterns rather than following generic advice.
Caffeine and Alcohol Consumption
Recording your caffeine intake and alcohol consumption alongside sleep metrics reveals how these substances affect your rest. You might be surprised to see that afternoon coffee still impacts your sleep quality hours later, or that alcohol reduces REM sleep even when it helps you fall asleep initially.
Visual dashboards present this information through correlation charts or comparative analysis, making cause-and-effect relationships clear without requiring complex statistical knowledge.
Smart Alarms and Wake Windows ⏰
Beyond tracking, modern sleep dashboards incorporate intelligent features designed to optimize your waking experience. Smart alarm functions analyze your sleep stages and wake you during light sleep within a specified window, helping you feel more refreshed and alert.
Dashboard visualizations show where in your sleep cycle the alarm activated, helping you understand why some mornings feel easier than others. Over time, you can adjust your target wake time based on your natural sleep architecture and pattern recognition from your dashboard data.
Popular Sleep Tracking Apps with Excellent Dashboards
Several applications have mastered the art of presenting sleep data in visually compelling and useful ways. These platforms make sleep improvement accessible to anyone with a smartphone or wearable device.
Sleep as Android: Comprehensive Tracking for Android Users
Sleep as Android offers one of the most detailed sleep dashboards available on the Android platform. The app uses your phone’s sensors or integrates with wearables to track sleep stages, record snoring, and even detect sleep talking. Its dashboard presents data through intuitive graphs and provides actionable advice based on your patterns.
Sleep Cycle: User-Friendly Visualization
Sleep Cycle has earned popularity for its clean, minimalist dashboard design that doesn’t sacrifice functionality. The app presents sleep quality scores, detailed stage breakdowns, and trend analysis in an instantly understandable format. Its comparative features allow you to see how different lifestyle factors correlate with your rest quality.
Pillow: Elegant iOS Sleep Tracking
For iOS users, Pillow delivers sophisticated sleep analysis wrapped in an elegant, Apple-design-inspired interface. The dashboard uses beautiful visualizations to show sleep stages, heart rate data, and audio recordings of snoring or sleep disturbances. Integration with Apple Health provides a holistic view of how sleep relates to other wellness metrics.
Making Sense of Sleep Score Algorithms
Most sleep dashboards feature an overall sleep score—typically ranging from 0-100—that summarizes your night’s rest quality. Understanding how these scores are calculated helps you interpret what the numbers actually mean and which factors to prioritize for improvement.
Sleep scores generally combine multiple factors: total sleep duration, time spent in each sleep stage, number and length of awakenings, sleep onset latency (time to fall asleep), and consistency with your sleep schedule. Different apps weight these factors differently, which is why the same night might receive varying scores across platforms.
Rather than obsessing over achieving perfect scores every night, dashboards help you identify your personal baseline and watch for meaningful trends. A consistent score in the 70-80 range with minimal disruptions might indicate better sleep than occasionally hitting 90 but with high variability.
Actionable Insights: Turning Data Into Better Sleep 💡
The ultimate value of visual sleep dashboards lies not in the data itself but in the behavioral changes they inspire. The best dashboards go beyond mere presentation to offer personalized recommendations based on your unique patterns.
Identifying Your Sleep Chronotype
Dashboard data collected over weeks reveals whether you’re naturally an early bird, night owl, or somewhere in between. This information, displayed through consistent bedtime and wake time patterns, helps you align your schedule with your biological tendencies rather than fighting against them.
Visual representations of when you naturally feel sleepy versus when you actually go to bed can highlight misalignments causing poor sleep quality. Adjusting your schedule by even 30 minutes in alignment with your chronotype can produce dramatic improvements.
Testing Sleep Hygiene Changes
Sleep dashboards turn sleep hygiene recommendations from abstract advice into testable hypotheses. You can implement changes—like reducing screen time before bed, adjusting room temperature, or modifying your dinner timing—and clearly see the impact through dashboard metrics.
This experimental approach makes sleep improvement feel less like guesswork and more like a science project where you’re both researcher and subject. The visual feedback creates motivation to continue beneficial habits and abandon those that don’t actually help your particular sleep needs.
Avoiding Common Dashboard Interpretation Mistakes
While visual sleep dashboards provide tremendous value, certain pitfalls can lead to misinterpretation or unnecessary worry. Understanding these common mistakes helps you use these tools effectively without creating additional stress.
Night-to-Night Variability Is Normal
Naturally, sleep quality fluctuates from night to night based on countless variables. Obsessing over a single poor night’s data creates anxiety that paradoxically worsens subsequent sleep. Dashboard trend views help maintain perspective by showing weekly or monthly patterns rather than isolated incidents.
Accuracy Limitations of Consumer Devices
Most sleep tracking apps and wearables use algorithms that approximate sleep stages rather than measuring them with medical-grade precision. While generally reliable for identifying patterns and relative changes, they’re not perfectly accurate for absolute measurements.
Understanding this limitation prevents unnecessary concern if your dashboard shows unusual readings on occasion. The value lies in trend detection and comparative analysis rather than treating every metric as absolute truth.
Advanced Dashboard Features Worth Exploring
As sleep tracking technology evolves, dashboards increasingly incorporate sophisticated features that provide even deeper insights into your rest quality and overall wellness.
Heart Rate Variability Tracking
Heart rate variability (HRV) measures the variation in time between heartbeats and serves as an indicator of recovery, stress levels, and overall health. Advanced dashboards display HRV trends alongside sleep metrics, revealing how well your body is recovering during rest and whether you’re overtraining or overstressed.
Sleep Debt Calculation and Recovery Plans
Some dashboards calculate accumulated sleep debt and provide visual recovery timelines showing how long quality sleep will take to restore your optimal rest balance. These projections help you make informed decisions about prioritizing sleep during busy periods and planning recovery time.
Partner Sleep Tracking and Comparison
For couples sharing a bed, certain apps offer dual tracking with comparative dashboards. These visualizations can reveal whether one partner’s movements disturb the other’s sleep or if environmental factors affect both sleepers differently, informing decisions about mattress quality, room conditions, or sleep schedules.
Building a Sustainable Sleep Improvement Routine 🎯
The ultimate goal of using visual sleep dashboards is developing sustainable habits that consistently deliver quality rest. Success comes not from perfect adherence to rules but from understanding your unique sleep needs and creating routines that work with your lifestyle.
Start by establishing a baseline through at least two weeks of consistent tracking without making major changes. This data provides a reference point for measuring improvement. Your dashboard will reveal your natural patterns, typical sleep duration, and baseline sleep quality scores.
Next, implement one change at a time—whether adjusting bedtime, modifying room temperature, or establishing a pre-sleep routine—and track results for at least a week before adding another variable. This methodical approach, guided by dashboard feedback, helps identify which interventions actually benefit your sleep versus those that make little difference.
Remember that sustainable improvement happens gradually. Visual dashboards excel at showing incremental progress that might not be immediately noticeable day-to-day but becomes clearly apparent when viewing monthly trends. Celebrate small gains in sleep efficiency, reduced wake times, or increased deep sleep percentages as meaningful victories on your journey toward better rest.
The Future of Sleep Visualization Technology
Sleep tracking and visualization technology continues advancing rapidly, with emerging innovations promising even more accessible and actionable insights. Artificial intelligence increasingly powers predictive analytics that can forecast poor sleep before it happens based on your patterns and daily activities.
Integration with smart home systems allows automatic environmental adjustments—temperature, lighting, and sound—based on your sleep stage data. These connected ecosystems use dashboard insights to create optimal conditions without requiring manual intervention.
As sensors become more accurate and algorithms more sophisticated, the gap between consumer sleep tracking and medical-grade polysomnography narrows. This democratization of sleep science means that high-quality rest analysis—once available only through expensive sleep studies—becomes accessible to anyone with a smartphone.

Transforming Your Relationship with Rest
Visual sleep dashboards represent more than just technology—they embody a fundamental shift in how we approach rest as a measurable, improvable aspect of wellness rather than a passive activity we simply hope goes well each night.
By making sleep quality visible, these tools empower you to take control of this crucial health pillar. The clarity provided by well-designed dashboards removes the mystery from sleep, replacing confusion and frustration with understanding and actionable pathways to improvement. Whether you struggle with insomnia, want to optimize athletic recovery, or simply wish to wake feeling more refreshed, visual sleep tracking provides the insights needed to make meaningful progress.
The journey toward better sleep doesn’t require complex interventions or expensive consultations. With the right dashboard guiding your decisions, simple adjustments informed by your personal data can unlock the restorative rest your body needs and deserves. Sweet dreams and happy tracking! ✨